Imagine a dashboard
you can ask questions
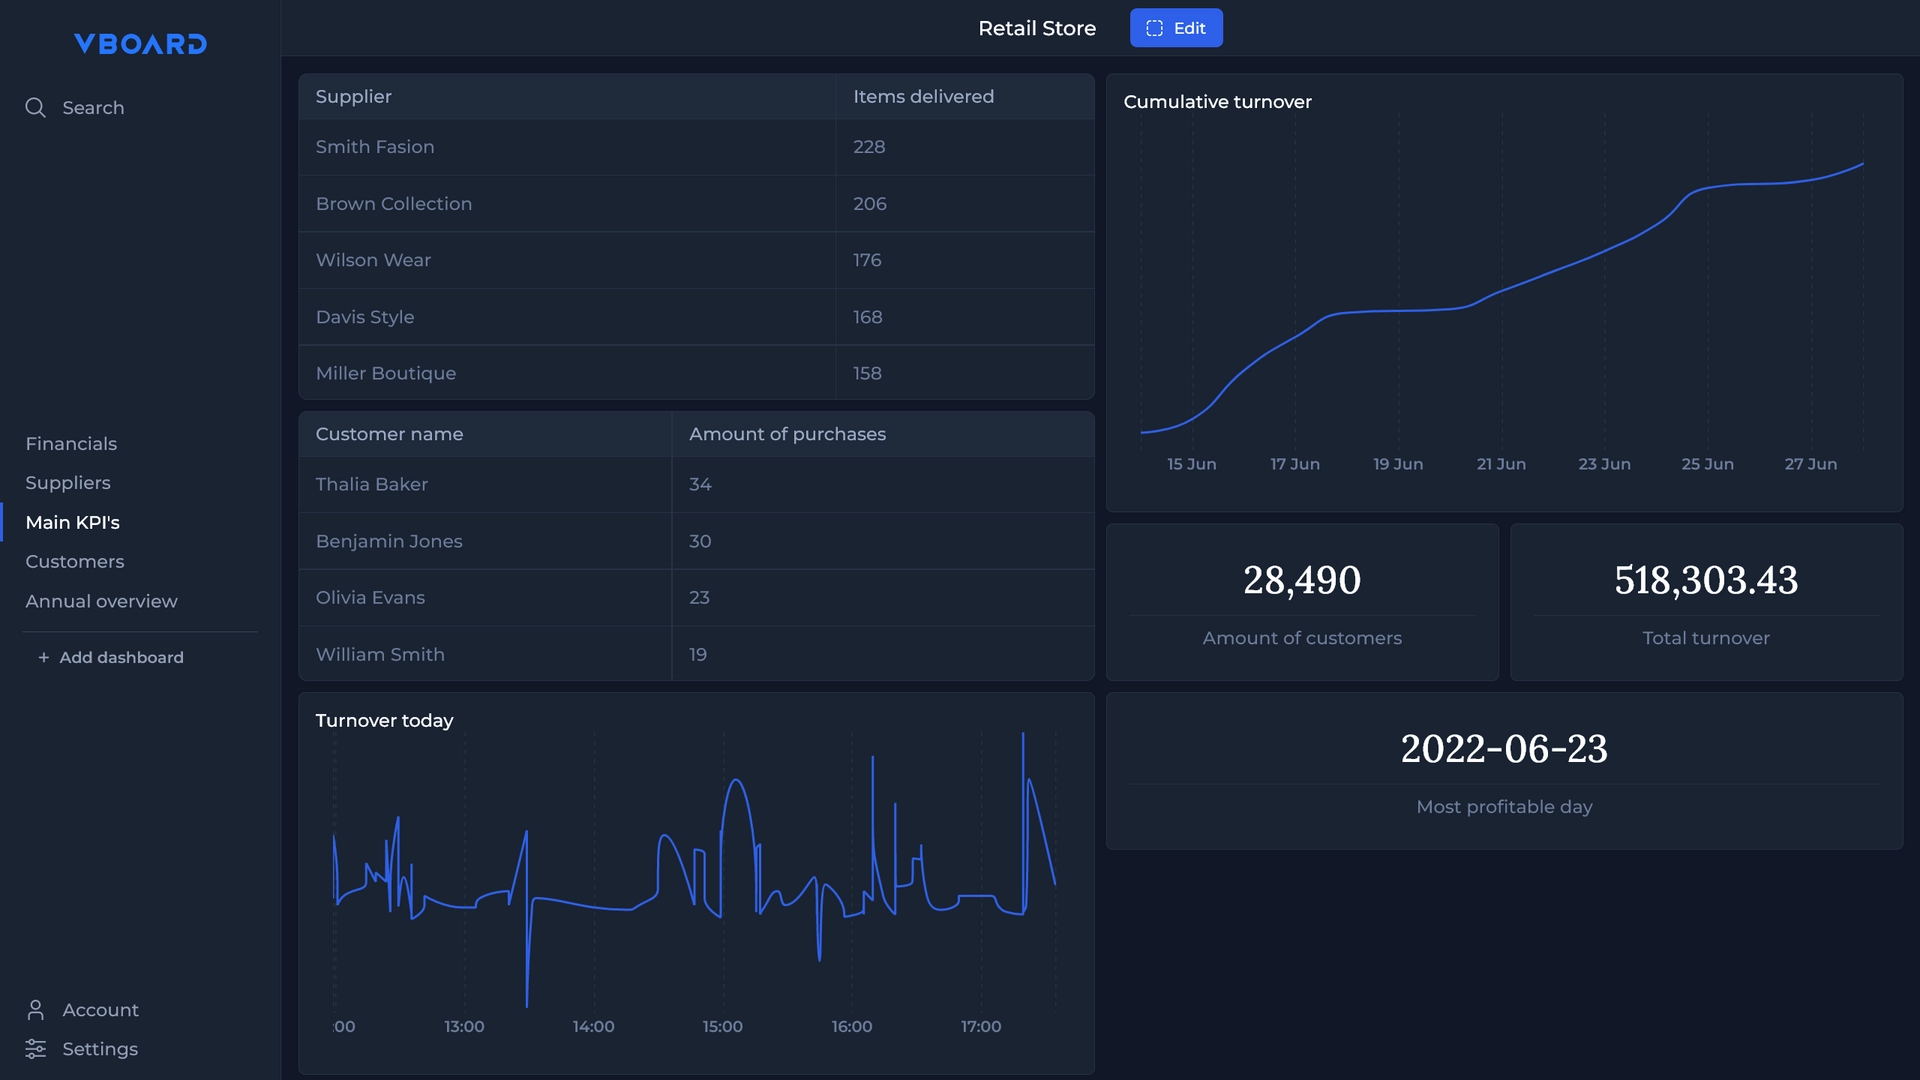
Integrates with your systems
Intelligent Chart Selection
Our system analyzes your question and the available data to determine the best way to
display the information. Whether it's a bar graph, line chart, pie chart, or any other type
of visualization, Adapta ensures that the data is presented in a clear and concise manner.
Not only does this save time and effort, but it also leads to more accurate and
impactful insights. With Adapta's intelligent chart selection, you can focus on the big
picture, rather than getting bogged down by the details.
Flexible layout
Create a dashboard that's tailored to your unique needs and preferences. Whether you want to
view multiple widgets on one screen or dedicate an entire screen to a single widget, our
platform gives you the freedom to design your dashboard your way.
We also offer a variety of customizable widgets, including charts, graphs, and tables, to help
you visualize your data in a way that makes sense to you. With Adapta, you'll have everything
you need to create an effective, informative, and stylish dashboard that meets your specific
requirements.